 VERSA
VERSA
Packaged Report Command
VERSA can generate a first-class report directly from a scoring JSONL file or a directory of result files:
versa-visualize results.jsonl --out report.html
The HTML report includes a radar overview, category sunburst, summary tables, mean/std, 95% confidence intervals, failure counts, best/worst examples, and outlier examples. CSV and Markdown exports are also available:
versa-visualize results.jsonl --out report.html --csv report.csv --markdown report.md
For model comparisons, group records by a field and VERSA will add per-metric rankings:
versa-visualize results.jsonl --out report.html --group-by model
The aggregation command can also write summary reports:
versa-aggregate results.jsonl --out metrics_report.csv
versa-aggregate results.jsonl --out metrics_report.md --format md
For a quick smoke test after installation, run the bundled toy example:
demo/run_reporting_example.sh
It reads demo/reporting_example_results.jsonl and writes an HTML report plus
CSV/Markdown summaries to ${TMPDIR:-/tmp}/versa-reporting-example.
Steps
- Additional Package Dependency Installation
pip install -r scripts/visualization/requirements.txt
- Aggregate the Results to Text Table
python scripts/show_result.py <your_path/results.jsonl> --export-csv
--export-csv outputs ./metrics_analysis.csv
- Convert the csv Format
python scripts/visualization/build_metricsTree.py --input_file ./metrics_analysis.csv --output_file ./metrics_tree.csv
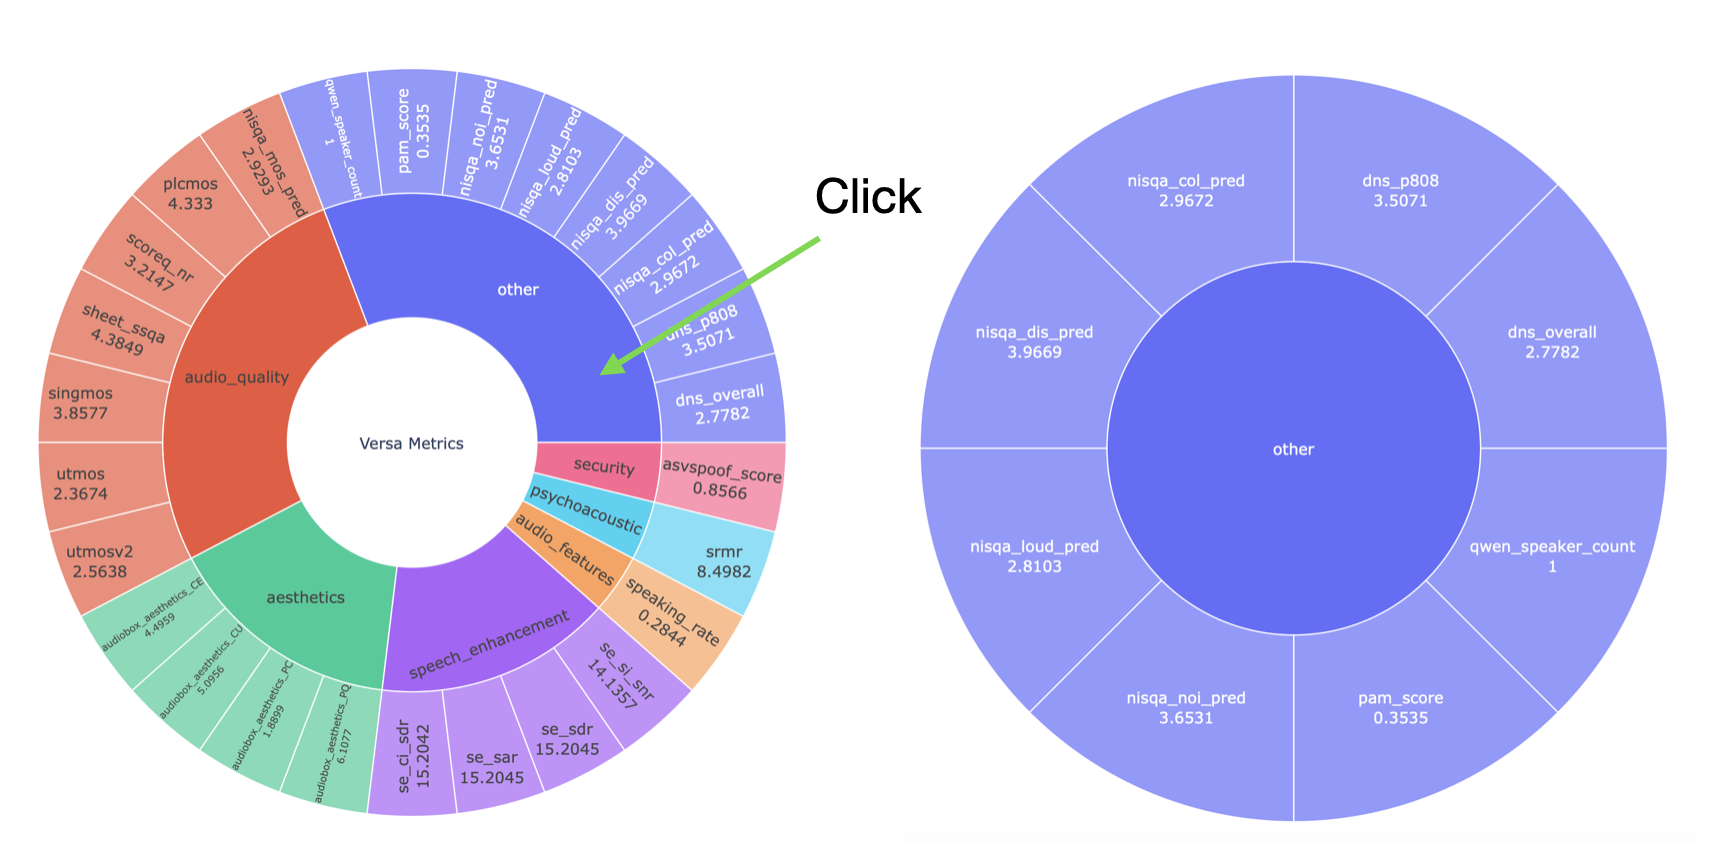
- Visualize the Sunburst Chart
python scripts/visualization/sunburst_chart.py --result_filepath metrics_tree.csv
Please also set --save_html Ture if your machine cannot directly forward port. Then download the
html file to your local machine.
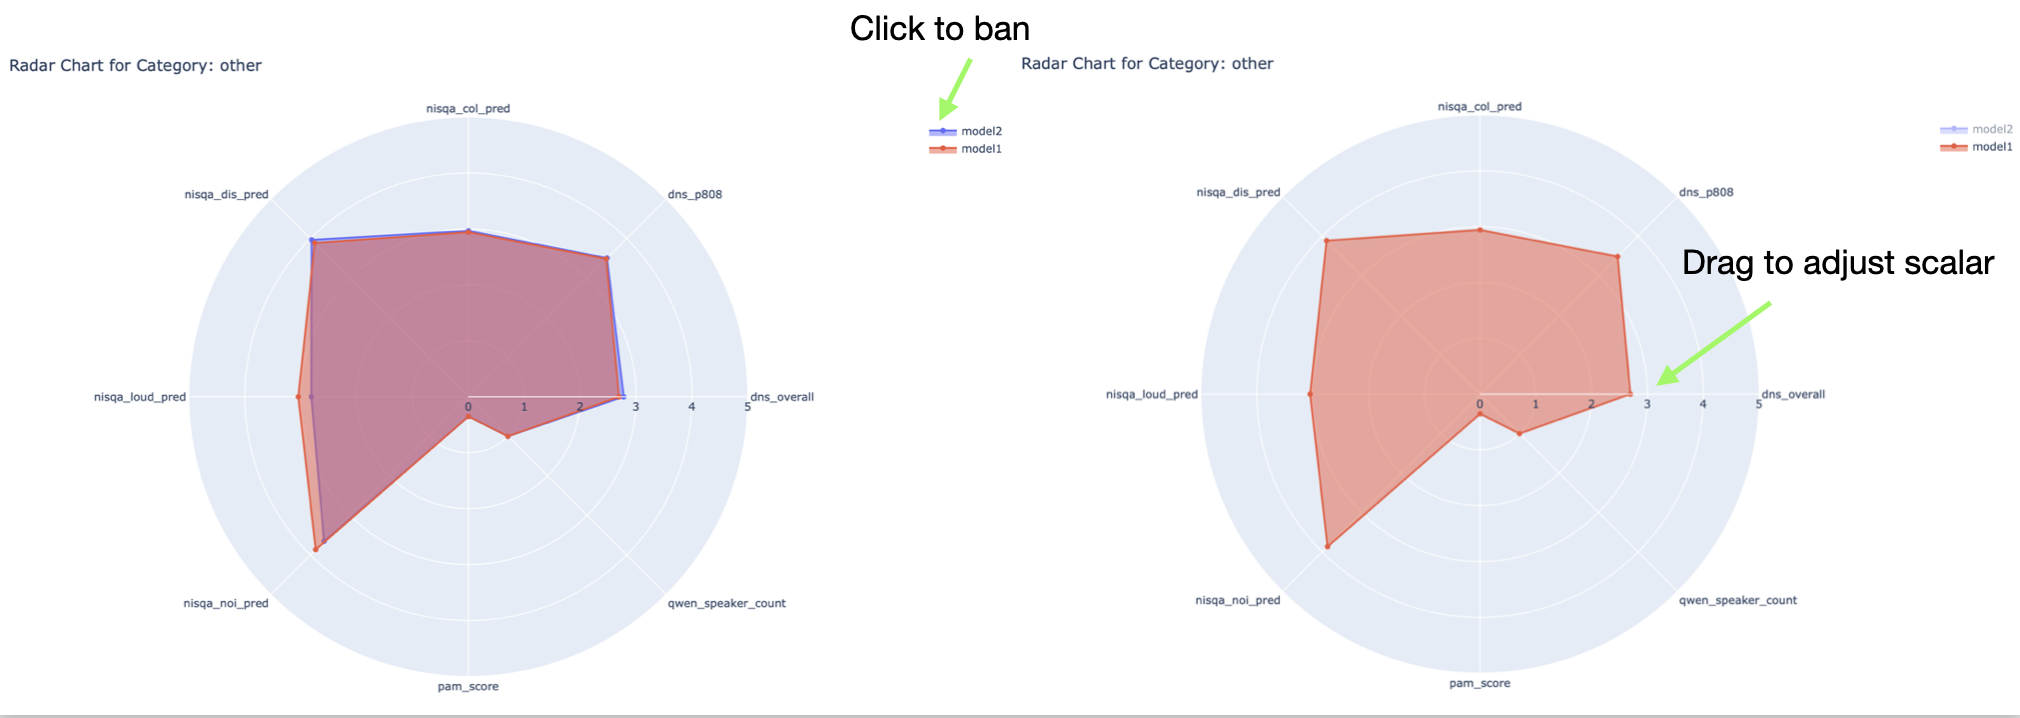
- Visualize the Radar Chart
Collect
metrics_tree.csvof different models tooutput_csvs/*.csv, then rename the csv files using model name.
Please specify either a sub category of versa metrics using --category or a set of metrics using --metrics.
python scripts/visualization/radar_chart.py --data_dir output_csvs --category aesthetics

python scripts/visualization/radar_chart.py --data_dir output_csvs --metrics pesq,stoi,mosnet
Please also set --save_html Ture if your machine cannot directly forward port. Then download the
html file to your local machine.
Samples
Aggregation policy
The scorer, versa-aggregate job aggregation, and reports share the numeric
policy in versa.result_summary. Every input row is an observation. Repeated
utterance keys are retained and counted separately, because a key alone cannot
distinguish a retry from another system's evaluation. Select the intended run's
records before aggregating; aggregation does not resolve resume checkpoints.
Fields are collected across all rows. Finite real numbers are averaged;
booleans, numeric strings, objects, nulls, NaN, and Infinity are excluded from
numeric reductions. Reports distinguish absent fields (missing) from present
unusable values (invalid), including entirely null or nonfinite fields. Pure
text and object fields are not discovered as numeric metrics. All-invalid
fields have no aggregate value and are omitted from avg_result.txt; their
report statistics retain the historical zero placeholders with count zero.
Empty input files produce empty summaries and valid empty reports.
Only names equal to, or ending in an underscore followed by,
{wer,cer,per}_{insert,delete,replace,equal} are summed as operation counts.
Other fields, including WER rate fields, are averaged. Reports expose Reducer
and Aggregate in CSV, Markdown, and HTML; Mean, confidence intervals,
and group rankings remain per-observation descriptive statistics.
An average of utterance error rates is not a corpus error rate. To calculate a
corpus rate, use complete operation records from the same observations and
compute (sum(delete) + sum(insert) + sum(replace)) /
(sum(delete) + sum(replace) + sum(equal)); zero reference tokens yield an
undefined rate. This change does not introduce or guess corpus-rate fields.
Private fields beginning with _, legacy text fields, reserved status/model/
protocol metadata, and the selected report grouping field are excluded from
score discovery. Store new provenance fields in _metadata or another private
envelope to keep them out of summaries.
Scoring writes one such envelope itself: _versa_completion records the
completion-contract schema version, the input identity, and the status of every
attempted metric. It exists so resume can tell a successful evaluation from a
failed or missing one, and it is never discovered as a score, ranked, or
averaged. A metric that failed or abstained still stores its usual null value,
so an all-invalid field keeps appearing in reports with its invalid count
rather than silently disappearing.
Job aggregation writes genuine JSONL to utt_result.txt, recursively replacing
nonfinite numbers with JSON null. It keeps avg_result.txt in its existing
name: value format. Report input mode continues to read historical Python dictionary records;
numbered job chunks require JSON objects.
Blank lines are ignored; malformed records or non-object rows raise an error
with the file and line number before aggregation opens its output files.